The following list highlights the greater attention to enterprise scalability of PerformancePoint Services 2010 over PerformancePoint Server 2007.
Scale Up
Scale Out
Common Dashboard Framework and Infrastructure
MOSS Installer Framework
Enterprise Management Scenarios
Familiar Administration Environment
Fail Over
Logging
Ease of Deployment
PowerShell Management Scripting
PerformancePoint is a SharePoint site
KPIs on Columns
Multiple Actual Values
New Time Intelligence Formula Support
Variance
Calculated Metrics
Scorecard hierarchies available for filters
Cube formatting applied to KPIs
Time intelligence formula editing
Improved filtering
Sort and filter on non-numeric values
Navigation on bottom axis
Improved numeric formatting
Analysis Services conditional formatting

Scale Up
Scale Out
SharePoint Repository
Objects created in PerformancePoint 2010 are now stored in SharePoint lists and libraries, not in a separate database. Because of this new location, these other features come along too.- Single Security Model
- Single Security Administration Environment
- Enterprise Management Scenarios
- Backup and Restore
- Disaster Recovery
- The PPS administrator’s user experience is the SharePoint user experience
PerformancePoint is a SharePoint site
Filters compatible with SharePoint filters (WSS Connection Framework)
You can now use SharePoint’s standard connection framework to hook up PerformancePoint filters to standard SharePoint web parts.Foundation for more seamless integration
The SharePoint architecture provides the foundation to make these things possible.- Search, Indexing, Workflows
- Excel Services, Visio Server, Project Server
- Custom security implementations
Supported environments
New supported environments make it possible for PerformancePoint to run on the latest hardware, making the most out of the latest and greatest in speed and reliability.- PerformancePoint Services for SharePoint
- Windows Server 2008 64-bit
- SharePoint Server O14 Enterprise CAL
PerformancePoint 2010 Clients
These are the client browsers and operating systems that are now supported.- Windows XP or greater
- Internet Explorer 7.0 or greater
- FireFox 3.5
- Safari 3.5 (Mac only)
Scorecards
Scorecards have undergone significant changes. The following list should contribute to some fantastic performance indications.- Dynamic hierarchies with navigation
- Drill Down and Drill Up
- Dynamic Selections, such as Children and Descendants
Scorecard hierarchies available for filters
- Improved value filtering
- Improved status filters
- Filter empty rows or columns
New report (KPI details)
Find out the fine details for each KPI.- Displays information about KPIs
- Applied filters
- KPI name, description, properties
- Metrics with trend
- Actual and target values
- Created and modified date
- Indicator and thresholds
- Calculation
- Variance
- Scoring method and distribution graph
- Comments
- Person Responsible
Pie charts
A pie chart, a highly-requested chart type, has been added for PerformancePoint 2010.Analytic reports
- Value filtering in grids and charts
- Change measure on published reports
- Per-measure or per-column
Analysis Services conditional formatting

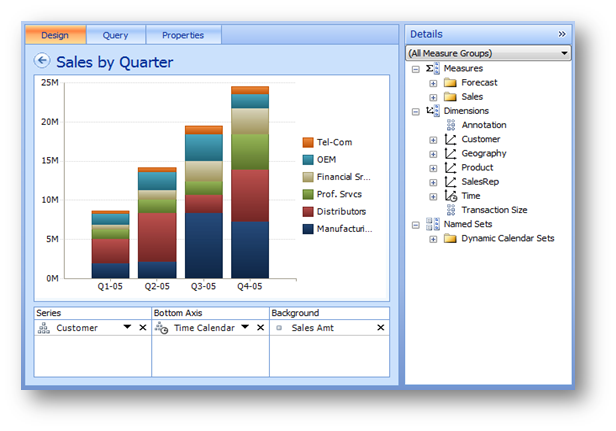
Analytic view designer
Notice the UDM organized cube layout inside the Details pane.Filters
Filters have come a long way in this version. Here are some of the enhancements- Reusable between dashboards
- Compatible with SharePoint filters (WSS Connection Framework)
- Time Intelligence filters for multiple data sources
Dashboard deploy
PerformancePoint now has on-click deployment to SharePointAccessibility and Globalization
- Accessibility meets SharePoint standard
- Scorecard Analysis Services KPIs honor client locale
- Dashboard accessibility now meets SharePoint's standard (WCAG 2.0 AA)


No comments:
Post a Comment