Showing posts with label Tabular Model. Show all posts

Sunday, 5 August 2012

Analysis Services 2012

Most important point to make about Analysis Services 2012 is that it is really two products in one. Analysis Services in the SQL Server 2008 R2 release and before is still present, but it is now called the Multidimensional model. It has had a few improvements relating to performance, scalability, and manageability, but there is no new major functionality. Meanwhile, there is a new version of Analysis Services that closely resembles PowerPivot—this is called the Tabular model.

What Is the BI Semantic Model?
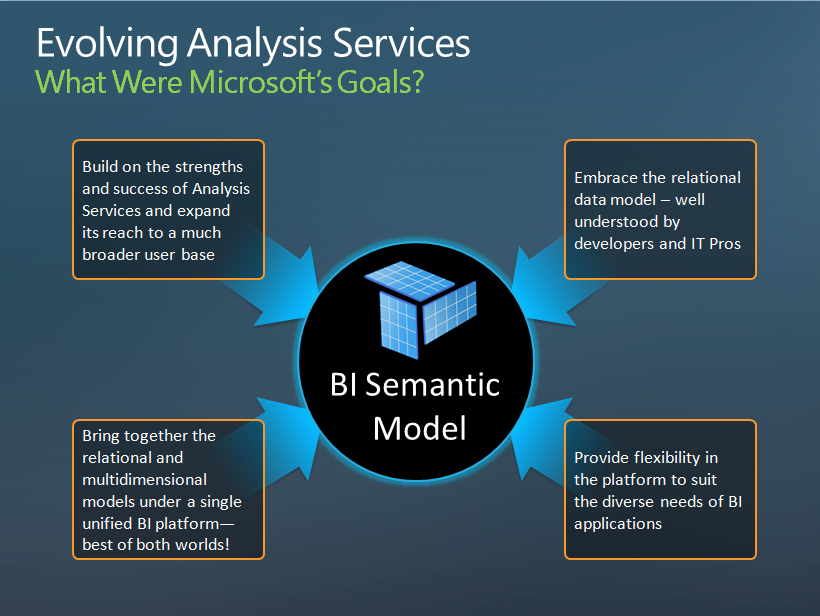
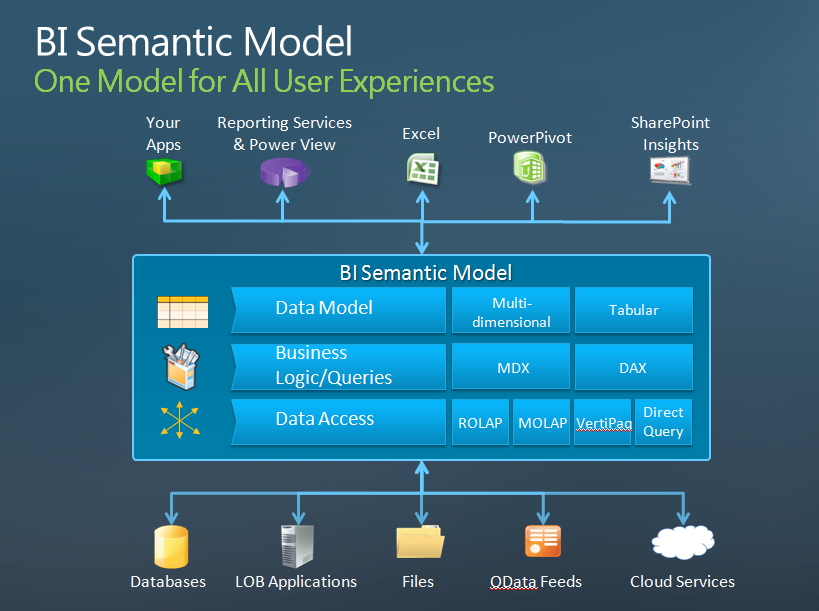
One term that has been mentioned a lot in the discussions about Analysis Services 2012 is the BI Semantic Model or BISM. This term does not refer to either the Multidimensional or Tabular models specifically but, instead, describes the function of Analysis Services in the Microsoft BI stack: the fact that it acts as a semantic layer on top of a relational data warehouse, adding a rich layer of metadata that includes hierarchies, measures, and calculations. In that respect, it is very similar to the term Unified Dimensional Model that was used around the time of the SQL Server 2005 launch. In some cases, the term BI Semantic Model has referred to the Tabular model only, but this is not correct.


Why Have Two Models?

Why has this split happened? Although Microsoft does not want to make any public comments on this topic, there are a number of likely reasons.
  • Analysis Services Multidimensional is getting old. It was designed in an age of 32-bit servers with one or two processors and less than a gigabyte of RAM, when disk-based storage was the only option for databases. Times have changed, and modern hardware is radically different; now a new generation of memory-based, columnar databases has set the standard for query performance with analytic workloads, and Analysis Services must adopt this new 10 Microsoft SQL Server 2012 Analysis Services: The BISM Tabular Model technology to keep up. Retrofitting the new xVelocity in-memory engine into the existing Multidimensional model was not, however, a straightforward job, so it was necessary to introduce the new Tabular model to take full advantage of xVelocity.
  • Despite the success of Analysis Services Multidimensional, there has always been a perception that it is difficult to learn. Some database professionals, accustomed to relational data modeling, struggle to learn multidimensional concepts, and those that do find the learning curve is steep. Therefore, if Microsoft wants to bring BI to an ever-wider audience, it must simplify the development process—hence the move from the complex world of the Multidimensional model to the relatively simple and familiar concepts of the Tabular model.
  • Microsoft sees self-service BI as a huge potential source of growth, and PowerPivot is its entry into this market. It is also important to have consistency between the Microsoft self-service and corporate BI tools. Therefore, if Analysis Services must be overhauled, it makes sense to make it compatible with PowerPivot, with a similar design experience so self-service models can easily be upgraded to full-fledged corporate solutions.
  • Some types of data are more appropriately, or more easily, modeled by using the Tabular approach, and some types of data are more appropriate for a Multidimensional approach. Having different models gives developers the choice to use whichever approach suits their circumstances.
The Future of Analysis Services
Having two models inside Analysis Services, plus two query and calculation languages, is clearly not an ideal state of affairs. First and foremost, it means you have to choose which model to use at the start of your project, when you might not know enough about your requirements to know which one is appropriate—and this is the question we will address in the next section. It also means that anyone who decides to specialize in Analysis Services has to learn two technologies. Presumably, this state of affairs will not continue in the long term.
Microsoft has been very clear in saying that the Multidimensional model is not deprecated and that the Tabular model is not its replacement. It is likely that new features for Multidimensional will be released in future versions of Analysis Services. The fact that the Tabular and Multidimensional models share some of the same code suggests that some new features could easily be developed for both models simultaneously. The post on the Analysis Services blog previously referenced suggests that in time the two models will converge and offer much the same functionality, so the decision about which model to use is based on whether the developer prefers to use a multidimensional or relational way of modeling data. Support for DAX queries in the Multidimensional model, when it arrives, will represent one step in this direction.


One other thing is clear about the future of Analysis Services: It will be moving to the cloud. Microsoft has confirmed it is working on a cloud-based version of Analysis Services and this, plus SQL Azure, SQL Azure Reporting Services, and Office 365, will form the core of the Microsoft cloud BI strategy.

Wednesday, 1 August 2012

What's New in Excel Services - SharePoint 2013

Excel Services:

Excel Services in Microsoft SharePoint Server 2010 is a shared service that you can use to publish Microsoft Excel 2010 workbooks on SharePoint Server. The published workbooks can be managed and secured according to your organizational needs and shared among SharePoint Server 2010 users, who can render the workbooks in a browser. Excel Services was introduced in Microsoft Office SharePoint Server 2007 and is available only in the Enterprise edition of SharePoint Server 2010.

Excel Services consists of Excel Calculation Services, the Microsoft Excel Web Access Web Part, and Excel Web Services for programmatic access. It supports sharing, securing, managing, and using Excel 2010 workbooks in a browser by providing the following:
  • Global settings for managing workbooks, which include settings for security, load balancing, session management, memory utilization, workbook caches, and external data connections.
     
  • Trusted file locations (which allow you to define which document libraries are trusted by Excel Services) together with session management, workbook size, calculation behavior, and external data settings of workbooks stored in those locations.
     
  • An extensive list of trusted data providers for connecting to your data, plus the ability to add your own trusted data provider.
  • Trusted data connection libraries, which allow you to define which data connection libraries in your farm are trusted by Excel Services.
     
  • The ability to add your own user-defined function assemblies.

Looking at several specific scenarios can help you understand how best to take advantage of Excel Services:
 
  • Sharing workbooks through the browser Users can save Excel 2010 workbooks to a SharePoint Server document library to give other users browser-based access to the server-calculated version of the workbook. When the workbook is accessed, Excel Services loads the workbook, refreshes the external data if it is necessary, calculates it if it is necessary, and sends the resulting output view back through the browser. A user can interact with Excel-based data by sorting, filtering, expanding, or collapsing PivotTables, and by passing in parameters. This provides the ability to perform analysis on published workbooks. A user does not have to have Excel 2010 installed to view the workbook. Users will always view the latest version of a workbook, and they can interact with it in a browser. Security permissions can be set to limit what access is provided to which user. 
  • Building business intelligence (BI) dashboards Browser-based dashboards can be created by using Excel and Excel Services together with the Excel Web Access Web Part. PerformancePoint Services can also use Excel Services workbooks as a data source.
  • Reuse of logic encapsulated in Excel workbooks in custom applications Besides a browser-based interface with the server, Excel Services provides a Web-service–based interface so that a published workbook can be accessed programmatically by any application that uses Web services. The Web service applications can change values, calculate the workbook, and retrieve some or all of the updated workbook by using that interface according to what security permissions are set for the published workbook.
  • Report Building One of the most useful features of Excel Services is report building. By publishing data-connected workbooks to a SharePoint document library and making them available through Excel Services, you can make reports that you have created in Excel available to others in your organization. Instead of multiple users having separate copies of the workbooks on their computers, the workbooks can be created and changed by a trusted author in a central location that is trusted by Excel Services. The correct version of the worksheet is easier to find, share, and use from Excel, SharePoint Server, and other applications.

The new ECS in SharePoint 2013 is pretty awesome, the Extel team has worked hard to make ECS on par with Excel. But wait what do these changes have in common with MOLAP? Well since most of the underlying Excel code is shared, a lot. Let me show you.

The Pivot table in Excel 2013 is created that points to the Adventureworks Molap cube. Nothing new yet here:


Now lets share this to SharePoint 2013, again nothing new here just a new UI:

Now lets open it in the browser, this is where things get interesting! Observe it looks very much like Excel 2013, and it even has a Pivot table fields list.


You now can change the pivot tables on the server (of course when you have the credentials) and add measures and rows and column all within the browser.


This is awesome! We now have a web based MOLAP browser that allows ad-hoc analytics. Just to make sure this is clear, this of course also works for Tabular


Monday, 9 July 2012

SSAS 2012 Tabular Model

Tabular models are in-memory databases in Analysis Services. Using state-of-the-art compression algorithms and multi-threaded query processor, the xVelocity in-memory analytics engine (VertiPaq) delivers fast access to tabular model objects and data by reporting client applications such as Microsoft Excel and Microsoft Power View.

Tabular models support data access through two modes: Cached mode and DirectQuery mode. In cached mode, you can integrate data from multiple sources including relational databases, data feeds, and flat text files. In DirectQuery mode, you can bypass the in-memory model, allowing client applications to query data directly at the (SQL Server relational) source.
Tabular models are authored in SQL Server Data Tools (SSDT) using new tabular model project templates. You can import data from multiple sources, and then enrich the model by adding relationships, calculated columns, measures, KPIs, and hierarchies. Models can then be deployed to an instance of Analysis Services where client reporting applications can connect to them. Deployed models can be managed in SQL Server Management Studio just like multidimensional models. They can also be partitioned for optimized processing and secured to the row-level by using role based security.


  • A single term like BISM suggests that Analysis Services 2012 and PowerPivot are a single, cohesive product, whereas the Tabular and Multidimensional models are actually very different beasts. If you’re going to be working with Analysis Services 2012 on a project the first decision you’ll have to make is which type of model to use, and if you change your mind later you’ll have to start development again from scratch and learn a lot of new skills. I hope one day that the two models will merge again but it won’t happen soon.
  • Microsoft has correctly identified that many people want to do BI but were put off by the complexity of building Multidimensional models in previous versions of Analysis Services. The simplicity of the Tabular model goes a long way to solving this problem; Tabular also replaces Report Builder models which were really a just a simple semantic layer for people who didn’t like SSAS or had valid reasons to stay with relational reporting. In order not to scare off this market a new name is necessary to avoid the negative connotations that come with “Analysis Services” and “cubes”.
  • Calling something a “semantic model” suggests that it’s a nice, light, thin, easy-to implement layer on top of your relational data warehouse, with no data duplication (which is often seen as a Bad Thing) involved. In actual fact anyone who has used the Multidimensional model will know you almost always use MOLAP storage which involves all the data being copied in Analysis Services; and I suspect when people start using the Tabular model they will be using it in Vertipaq mode (where again all the data gets copied into Analysis Services) rather than in DirectQuery mode (where all queries are translated to SQL which is then run against SQL Server).